
INTRODUCTION
A type of heat buildup phenomena brought on by urban development and human activity is known as the urban heat island (UHI) effect. It is acknowledged as the most blatant feature of the metropolitan climate. The urban heat island (UHI) effect will undoubtedly raise land surface temperatures, which will change the structure and functions of urban ecological systems and affect material and energy flow. These changes will have a range of ecological and environmental effects on urban climates, urban hydrologic situations, soil properties, atmospheric environments, biological habits, material cycles, energy metabolism, and the health of the population. UHI effects could be greatly reduced by increasing energy efficiency, optimizing urban landscapes, building green roofs, using high reflectivity materials, and cultivating green land. Research on the ecological and environmental consequences of urban heat island (UHI) has been undertaken on several scales using remote sensing technologies and numerical simulation methodologies. The results of this research provide theoretical guidance for enhancing the urban ecological environment and implementing sustainable urban development. Urban regions are becoming more and more essential; as of 2013, 76% of people in industrialized countries and 52% of the world's population lived in cities (Population Reference Bureau, 2013). As the world's population is expected to continue growing, with 67% of people living in cities by 2050 (United Nations, 2012), it is critical to advance our knowledge of the intricate interactions between urbanization, climate change, and human health. Reducing electricity usage has been a major issue of concern, as stated by the Indian government's National Mission of Sustainable Habitat. Delhi has the greatest electricity use of any city in India. Metropolitan microclimates (UMCs) have emerged in metropolitan regions as a result of densely populated areas, concrete zones, and high concentrations of human activity. The phenomena of urban heat islands, or UHIs, is linked to the development of UMCs. Widespread urbanization modifies the energy balance by changing the land use/cover (LULC), which makes cities warmer than their hinterland and surrounds. Delhi, the administrative capital of India, is situated in the nation's interior and is home to a sizable concentration of residential neighborhoods and executive buildings. Global concerns about climate change have several repercussions. One such noticeable phenomena that is significant on a local, regional, and global scale is urban heat islands. The natural land cover of vegetation and fallow land is being rapidly replaced by impermeable land cover, or built-up regions, due to urbanization, which is substantially raising the land surface temperature (LST). Elevated temperatures exacerbate the meteorological conditions in metropolitan regions, leading to the Surface Urban Heat Island (SUHI) phenomenon and declining ecological state.
STUDY AREA
Uttar Pradesh is located in the northern part of India, and its geographical coordinates are approximately: Latitude: 26.8467° N to 30.3322° Longitude: 77.4136° E to 84.3219°E. One of the most populous states in India is Uttar Pradesh, which has highly populated urban centers. Heat is produced in metropolitan areas by the concentration of people and activity due to a variety of factors, including traffic, industry, and human metabolism. Urban temperatures rise as a result of the widespread use of concrete, asphalt, and other heat- absorbing materials in structures, roads, and pavements. These materials also inhibit natural cooling mechanisms like evapotranspiration.
As a result of urbanization, green spaces and vegetation are frequently eliminated. These elements are essential for controlling temperature because they provide shade and allow for evapotranspiration. The UHI impact is made worse by the removal of flora since it decreases natural cooling and increases heat retention. Urban temperatures are further exacerbated by waste heat produced by increased energy use for air conditioning, heating, and other amenities. Uttar Pradesh's urban regions are heavily polluted by emissions from moving cars, manufacturing, and other sources. Air pollution is caused by pollutants that trap heat, such as greenhouse gasses and particulate matter, which exacerbates the urban heat island effect.

MATERIALS AND METHODS

LAND SURFACE TEMPERATURE
When analyzing the dynamics of Earth's surface processes and determining how different environmental conditions affect local and regional climates, land surface temperature, or LST, is a crucial quantity to consider. The temperature of the Earth's surface as determined by satellite or ground-based data is referred to. LST accurately captures the thermal energy of the land, including the soil, plant, and built-up surfaces, in contrast to air temperature, which is measured at a specific height above the surface. Numerous fields, including agriculture, hydrology, urban planning, climate modeling, and natural resource management, rely heavily on LST data. It is an important surface energy balance indicator that sheds light on how heat is distributed throughout landscapes and how the atmosphere and land interact. Furthermore, variations in LST can act as precursors to environmental events including droughts, urban heat islands, and changes in land use. Recent developments in remote sensing technology have made it possible to acquire continuous temperature data across wide areas both geographically and temporally, which makes measuring and analyzing LST easier. Thermal infrared bands on satellite-based sensors enable LST calculation at multiple spatial resolutions, ranging from small neighborhoods to global sizes. High-resolution LST data at particular sites are provided by ground-based devices, such as thermal cameras and infrared thermometers, which supplement satellite observations.
>>Steps and Equations to find Land Surface Temperature:
-
Calculation of TOA (Top of Atmospheric) spectral radiance.
where:
ML = Band-specific multiplicative rescaling factor from the metadata (RADIANCE_MULT_BAND_x, where x is the band number).
Qcal = corresponds to band 10.
AL = Band-specific additive rescaling factor from the metadata (RADIANCE_ADD_BAND_x, where x is the band number).
Therefore, the equation must be solved using the Raster Calculator tool in ArcMap
-
TOA to Brightness Temperature Conversion
where:
K1 = Band-specific thermal conversion constant from the metadata (K1_CONSTANT_BAND_x, where x is the thermal band number). K2 = Band-specific thermal conversion constant from the metadata (K2_CONSTANT_BAND_x, where x is the thermal band number). L = TOA
Therefore, to obtain the results in Celsius, the radiant temperature is adjusted by adding the absolute zero (approx. -273.15°C).
-
Calculate tkc NDVI
-
Calculate the proportion of vegetation Pv
-
Calculate Emissivity ε
-
Calculate the Land Surface Temperature


Top of Atmospheric - spectral radiance
A key metric in remote sensing is the Top of Atmospheric (TOA) spectral radiance, which is the amount of light emitted or reflected by the Earth's surface and atmosphere as seen from space. It is an essential component of many applications, such as climate monitoring, atmospheric research, and the retrieval of surface attributes including sea surface temperature, vegetation health, and land cover
The radiant flux per unit solid angle per unit wavelength interval measured by a sensor at the top of the Earth's atmosphere is referred to as TOA spectral radiance. It includes solar radiation that is absorbed or scattered by atmospheric components, as well as naturally occurring emissions from the Earth's surface and atmosphere. Typically, satellite-borne sensors with various spectral bands covering the visible, near-infrared, and thermal infrared parts of the electromagnetic spectrum are used to detect TOA spectral radiance. These sensors record light at various wavelengths that the Earth's surface and atmosphere emit or reflect. Numerous remote sensing applications, such as oceanography, vegetation monitoring, atmospheric profiling, land cover categorization, and climate modeling, heavily rely on TOA spectral radiance data. Through the examination of TOA radiance in various spectral bands, scientists can deduce important details about the Earth's surface and atmosphere.


Radiance refers to the amount of electromagnetic radiation emitted, reflected, or transmitted by a surface per unit solid angle per unit area.
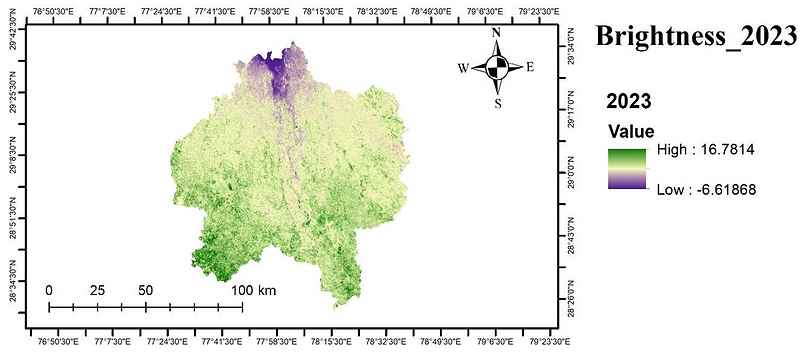
TOA to Brightness Temperature conversion
Thermal radiation released by a surface at microwave or thermal infrared wavelengths is measured by brightness temperature, or BT. It stands for the temperature of an imaginary blackbody that would radiate at the same rate as the surface that is being examined.
Temperature-emissivity separation and radiometric calibration are applied in the conversion of TOA radiance to brightness temperature. These methods provide an accurate estimation of the measured surface temperature by taking into consideration surface emissivity and atmospheric impacts. Applications for brightness temperature obtained from TOA radiance data in remote sensing and Earth observation are numerous. In addition to estimating land surface temperature, it is used to retrieve air temperature profiles, track thermal anomalies (such as volcanic activity and fires), and examine phenomena connected to climate change.


Brightness, particularly as it pertains to Urban Heat Island (UHI) calculation, typically refers to the surface temperature or thermal intensity of urban areas compared to surrounding rural areas.
Normalized Difference Vegetation Index (NDVI)
Based on the spectral reflectance characteristics of vegetation canopies, the Normalised Difference Vegetation Index (NDVI), a popular vegetation index in remote sensing, measures the quantity, health, and vigor of vegetation. NDVI is an essential tool in many disciplines, including forestry, agriculture, ecology, and land cover monitoring, because it offers insightful information about vegetation dynamics, environmental changes, and ecosystem health.The normalized difference between the red (R) and near-infrared (NIR) spectral bands of remotely sensed imagery is used to compute the NDVI. Higher values indicate denser and healthier vegetation. NDVI values normally vary from -1 to +1. Dense, healthy vegetation is indicated by a number near +1, whereas non-vegetated surfaces, such as urban areas, aquatic bodies, or bare land, are indicated by values near zero or negative. Variations in photosynthetic activity, density, and vegetation cover can all have an impact on the NDVI. High NIR reflectance and low red reflectance are characteristics of healthy, actively developing plants, which translate into high NDVI values. On the other hand, NDVI levels are lower in vegetation that is stressed or sparse. In agriculture, NDVI is frequently used to measure vegetation stress, track crop health, and calculate crop yields. It helps with mapping forest cover, tracking deforestation, and evaluating the health of forests. Moreover, NDVI is used in ecological research for biodiversity evaluation, habitat mapping, and vegetation dynamics analysis.
NDVI = (NIR - R) / (NIR + R)
-
NIR represents the reflectance in the near-infrared band.
-
R represents the reflectance in the red band.


NDVI stands for Normalized Difference Vegetation Index. It's a common metric used in remote sensing to assess and monitor vegetation health and density.
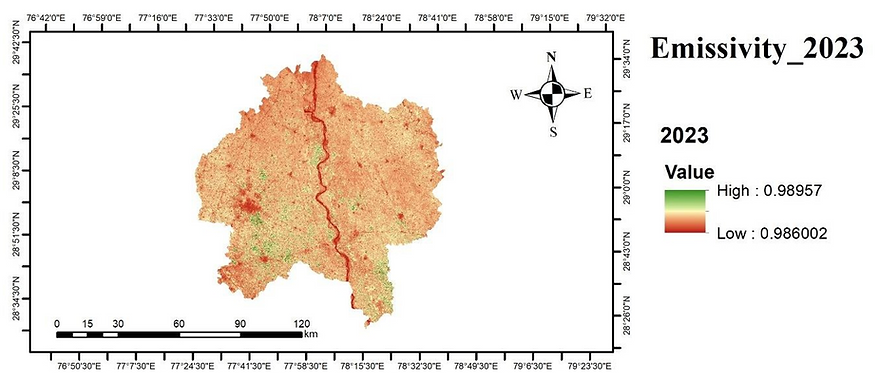
Emissivity
The ability of a surface to emit heat radiation in comparison to a perfect blackbody at a given temperature is known as its emissivity, which is a fundamental feature. It is expressed by a number between 0 and 1, where 1 is the ideal blackbody (perfect emitter) and 0 denotes a perfect reflector (no emission). Emissivity affects how temperature readings and energy balance calculations are interpreted, making it a critical factor in remote sensing, thermal imaging, and climate studies. The efficiency with which a surface emits heat radiation in comparison to a blackbody radiator is measured by its emissivity. High emissivity surfaces efficiently emit and absorb thermal radiation, whereas low emissivity surfaces reflect a large amount of received energy. Surface type and wavelength can affect emissivity. The molecular makeup and surface features of various materials give rise to distinct spectrum emissivity characteristics. In the thermal infrared spectrum, for instance, metals have a lower emissivity than vegetation, which normally has a high emissivity. Emissivity can be affected by surface coatings, moisture content, and surface roughness. Because of their many reflections inside surface features and enhanced absorption of radiation, rough or porous surfaces typically have higher emissivities. On the other hand, metallic or smooth surfaces might be less emissive, particularly at longer wavelengths. In thermal remote sensing applications including environmental monitoring, energy balance modeling, and land surface temperature estimation, emissivity measurements are crucial quantities. To maximize thermal performance and efficiency, they are also utilized in industrial processes, building insulation design, and materials research.


The inclusion of emissivity in the computation of UHI assures the precision of surface temperature determined from thermal images, thereby offering significant insights into the thermal properties of urban centers and their role in the UHI phenomena.
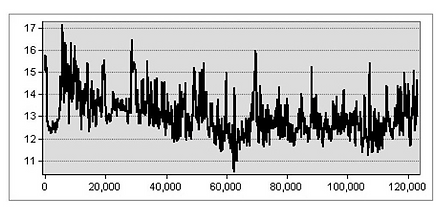
UHI_CALCULATION


.png)
Stack profile in urban heat island (UHI) calculation involves analyzing temperature data at different heights above the ground.
CONCLUSION
I compared the Urban Heat Island effect of the study area in summer and winter using a duration of three years of data from Uttar Pradesh for my study. The LST patterns show that whereas green regions and water bodies had comparatively low LST, built-up areas under urban growth displayed high LST. According to this study, UHI intensities seem to be declining, and temperatures in the winter cause comparatively less UHI than the summer temperatures. The NDVI data illustrate the different times when the vegetation occurs in the area. It is evident that in 2013, there is less vegetation over there, and by 2017, there is a change in the natural vegetation, which may be the cause of the higher LST in the 2013 era. Stack profile examines the effects of height-related temperature variations on atmospheric dynamics and urban climate. In order to better understand how temperature changes with height above the ground and to influence urban planning and climate mitigation efforts, the stack profile analysis offers insightful information about the vertical structure of the urban heat island.
References:
-
Rahman, M. N., Rony, M. R. H., Jannat, F. A., Chandra Pal, S., Islam, M. S., Alam, E., & Islam, A. R. M. T. (2022). Impact of urbanization on urban heat island intensity in major districts of Bangladesh using remote sensing and geo-spatial tools. Climate, 10(1), 3.
-
Kaloustian, N., & Diab, Y. (2015). Effects of urbanization on the urban heat island in Beirut. Urban Climate, 14, 154-165.
-
Kumar, A., Agarwal, V., Pal, L., Chandniha, S. K., & Mishra, V. (2021). Effect of land surface temperature on urban heat island in Varanasi City, India. J, 4(3), 420-429.
-
Parker, D. E. (2010). Urban heat island effects on estimates of observed climate change. Wiley Interdisciplinary Reviews: Climate Change, 1(1), 123-133.
.png)